
April 12, 2022


Editorial Disclaimer
This content is published for general information and editorial purposes only. It does not constitute financial, investment, or legal advice, nor should it be relied upon as such. Any mention of companies, platforms, or services does not imply endorsement or recommendation. We are not affiliated with, nor do we accept responsibility for, any third-party entities referenced. Financial markets and company circumstances can change rapidly. Readers should perform their own independent research and seek professional advice before making any financial or investment decisions.
Financial data just isn't the same these days. Honestly, it's exploded—it's faster, messier, and way more overwhelming. Remember when static spreadsheets did the job? Those days are long gone. Markets can flip in a blink, literally milliseconds.
So now, teams need dashboards that update in real time. This juggles tons of columns without breaking a sweat. According to IDC, global data creation will reach 175 zettabytes by 2025, much of it financial. That's an avalanche of information.
That's where ReExt comes in.
It combines the flexibility of React data development with Ext JS's enterprise-grade data grid. This gives you high-speed rendering, smooth updates, and reliable grid elements—even when working with large datasets. React Native is a cross-platform app development framework, so it is helpful in creating cross-platform apps.
ReExt can handle everything very nicely, like writing custom logic for valid CSS grid column structures or reworking messy column definitions. You just focus on building, from complex filters to responsive sorting across multiple columns. This React data grid is built to perform, especially in high-pressure environments like fintech or trading desks. So yeah, if you want insights that are fast and clean, this is your new best friend.

Let's be honest—financial data isn't your average dataset. It's layered, unpredictable, and can get downright messy. You're often juggling time-series records, massive transaction logs, forecasts, P&L breakdowns, and market analytics—all on one screen. Now add semi-structured reports from third-party sources? Honestly, it just gets harder to keep things neat and organised.
A traditional table just won't cut it here. You need a React UI Component Library that can make sense of all this chaos in real time. That's where something like a datagrid component really shines. It can handle both structured and semi-structured data. It lets the teams analyse patterns across both the updated rows of objects effortlessly.
For example, Let's say your CEO wants to review each department earning. The row grouping feature helps visualise this in one clean view, without clicking through tabs or switching filters.
Speed is everything in financial dashboards. Users expect instant updates and zero lag and even with large datasets. Real-life example include a fintech startup that had over 200,000 records loading into their dashboard daily. They nailed it with frozen columns and some clever width calculations. Everything scrolls super smoothly now. Honestly, even their investors were kind of blown away.
Here's what helps:
React grid let you define a columns array with specific behaviour for each column object. Want to support pinning columns or implement left frozen columns? Its Easy. Even you can dynamically calculate column width based on content.
Performance tweaks can make a real difference. One quick win? Use a static or memorised header component. That way, it doesn't get redrawn every time the row data changes. Honestly, this helps a lot, especially if you're highlighting selected row indexes or tracking row keys. These Small fixes have a big impact.
Need fine control? Customise with the default behaviour function oncellcontextmenu or tweak the default auto-width logic per cell. Bottom line? Financial teams can't afford delays or incomplete views. A solid grid system with the right grid element function support helps keep decisions fast, reliable, and data-rich.
Financial dashboards live and die by how well they present complex data. And let's face it—Excel-like tools just don't cut it anymore when you need real-time updates. Thousands of rows of data, and the flexibility to manipulate every interface row.
This is where React Data Grids shine. At their core, they're advanced tables. But they're smart tables. You can add row grouping and create custom summary row type views. It helps control every pixel of your datagrid columns. Developers love how responsive they are.

For example, each column resize handle lets users drag and adjust without delay, even with 100+ columns and rows. You can also easily toggle a column sortable option. Which let the users rank data without waiting for backend calls.
Need users to scroll through 1,000 entries? Its smooth sailing. You can even track the currently selected cell onscroll. So, updates happen in real time, right where the user is looking.
Now, building all this from scratch? Honestly, it's a nightmare.
ReExt (Rapid Ext JS for React Application Development Software) handles the heavy lifting. It manages new rows array updates efficiently, with no weird flickering or freezing. The column scrollbar works even when your table stretches a mile wide. Users can group, filter, and rearrange with drag-and-drop (or disable it with false enable dragging).
Financial teams can review dashboards in dark mode support, which saves their eyes after hours. Plus, ReEx supports full control through the args column functions. That means every header cell or interface row can behave exactly the way your app needs. No hacking required.

When React Data Grids get paired with ReExt, it totally transforms how financial data gets handled. For devs, it's cleaner code and fewer bugs. For decision-makers, it's clarity at speed.
The following are the key benefits of using ReExt for financial data analysis:
Ever find yourself in a situation where you want to load a massive financial dataset, and your grid is chugging like a tortoise? Frustrating, huh?
This is where ReExt comes in. It spins up real-time data feeds or updates effortlessly, even in situations of high use. If you are updating financial data from stock prices, forex. Even updating the transaction logs, ReExt can help keep everything fast and fluid.
In a nutshell, the grid is very clever and uses virtualisation as it normally doesn't render rows beyond what is visible. This keeps the memory usage to a minimum. Ensuring that your users are scrolling without pause—even with thousands of rows.
In addition, your grid width will even adjust automatically. So your layout fits the screen properly with each trading screen. Consider this basic example, a trading dashboard that comes from a live data feed via WebSocket. It updates price every second.
With React DataGrid, the ReExt framework will ensure that each edit cell remains interactive. It does not freeze the interactivity of the other columns of the table.
Also, the performance is always predictable, as updates are automatically determined based on what changes (no tacky manual syncing). ReExt also provides a minimum keyboard accessibility setup in TypeScript, snappy cell editing with fallback logic, and smooth horizontal scrolling through wide financial reports.
So, if your financial team or market data team needs super-fast grids, this is the one!
Financial teams reign supreme in spreadsheets. They'll be sorting, filtering, and calculating until the cows come home—and there are lots of cows in finance.
It is important that filtering feels just as natural when building a financial dashboard. ReExt delivers that natural filtering experience with power and precision. Setting up multi-level filters that react right away—even with larger datasets.
For example, you want to filter all transactions >= $10,000 for Q4. Using ReExt, you can create consecutive filters by date, dollar amount, or category, without the wheel of agony. You can also trigger a function called renderEditCell to calculate totals dynamically.
You can create summary cells with live stats such as averages, totals, and trends. Think of it like Excel's auto-summary but within a React datagrid. Every summary cell reacts to edits when values are changed.
And yes, you can customise how cells navigate to make it simple to tab between columns and lock a readonly column if necessary—all without writing heavy logic and styling from scratch!
You can create custom formulas, tweak margins, and even handle awards—yep, all built-in. Right-click and you'll find context-aware filters right there in the menu, which makes digging through data way easier. And when you're editing a cell? It instantly checks your input, with no delays or fuss.
The best part is that all of this works seamlessly with the cell editor tools. So when you're adjusting values, you can see the changes happen in real time. Super handy, especially when precision matters.
Let's face it—finance folks love their pivot tables. They're powerful, familiar, and essential.
ReExt brings that same experience to your web application development. It also helps in Enterprise software development. You can group, summarise, and pivot your financial data right inside the react datagrid—without jumping into Excel.
Say you want to break down revenue by region and product type. You simply drag the column's draggable headers into groups. Boom—instant summary by row and column. Need to lock categories in place? Just set them as a read-only column.
Each summary cell updates live. Want to dive deeper into a product group? Click to expand—no reloads, no delays. You can also add custom formulas, like growth rates or year-on-year deltas, right inside your edit cell.
This setup gives decision-makers:
You can also link cell editing to row type sr, so users only edit data in specific sections. And if needed, use a cell editor to let users enter values that trigger auto-pivot recalculations. It's all handled efficiently, with behaviour determined automatically based on layout and interaction rules.
Let's be real—exports can be a total pain if your grid isn't playing nice.
You make all these tweaks, filter columns, calculate totals, and then—bam! The export throws a messy dump. But ReExt? Way smoother. You hit export, and it actually respects what's on your screen.
Let's say you've got your summary cells set up, showing net profits or quarterly sums. ReExt keeps those intact, and there are no extra code gymnastics. Same for filters. You filter by department or region? Your exported file mirrors that view—nothing more, nothing less.
Also, I like how it handles API-based exports. Need to connect with Power BI or QuickBooks? You just plug into their endpoints, and there are no crazy hacks. And yeah, it even plays well when you're editing data. Midway through a tweak in the open cell editor? You can still trigger an export. Pretty slick.
Other cool bits:
Honestly, it's that kind of polish that saves headaches when reports are due and everyone's breathing down your neck.
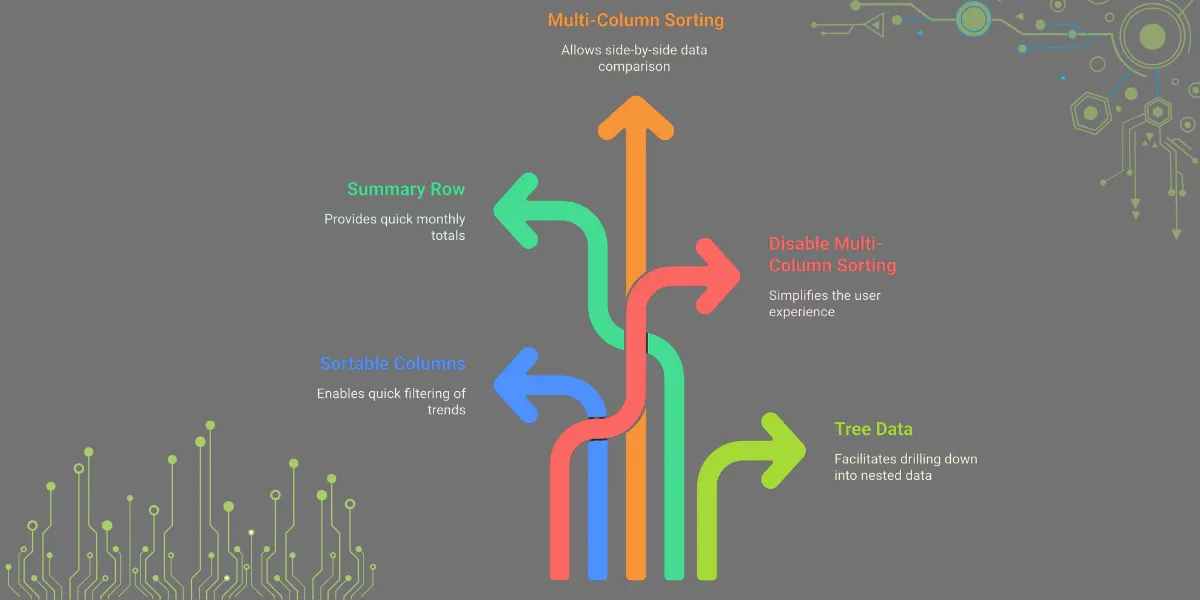
If you're working with financial dashboards or large datasets, choosing the right data grid component really matters. You don't want to be stuck rebuilding features like multiple column sorting or custom row tools from scratch.
A solid data grid should honestly just make your life easier—it needs to manage logic without turning things into a mess. Take this for example: when you use const columns inside your function App, you're basically laying out exactly how your data should appear. It's a clean setup that's easy to tweak later.
Now, when changes happen—because they always do—the grid should have your back. It should let you update the changed rows without messing up everything else. You want consistency across the row elements, not chaos, right?
Sometimes you need to simplify too—like when you want to disable multiple column sorting to avoid user confusion. Features like indexes array highlighting also come in handy when tracking row positions during edits or drag-and-drop.
Bottom line: pick a library like ReExt that gives you all this, out of the box. It'll save you time and mental energy.
It lets you handle columns, rows, and visible rows with ease, even in real-time updates.
Absolutely—just install react data grid, drop it in, and update the columns flow to match your layout.
From budgets to forecasts, even sorted columns or dynamic selected row keys—you can track all of it.
Yes. Even the header row gets exported, whether or not you've used a static or memoised component.
Nope. Just create a new columns array and set false enable sorting where needed—super flexible.
Download the ReExt Starter Kit!
